


Autonomous Thinking Desk
Five sensors, six metrics: the cognitive-environment engineering behind Thinking Desk
We engineered Thinking Desk's keypad around five sensor chips that produce six metrics tracking what degrades cognitive performance during a 12-hour session — plus a presence sensor for sit/stand awareness. Here's the literature and design rationale behind every choice.
.webp)
This paper documents the sensor engineering behind Thinking Desk. Five sensor chips, built into the keypad, produce six metrics that map to a builder's 12-hour session: temperature, humidity, noise, AQI, CO₂, and TVOC. A sixth chip — a Time-of-Flight presence sensor — tells the desk whether the builder is at the desk at all. Each chip was chosen against published cognitive-performance research, not against a marketing spec sheet. Other capabilities of the Thinking Desk app — sit/stand cadence and Claude Code token tracking — are covered in their own sections at the end of this paper, after the sensor work.
The 12-hour focus problem
Office desk telemetry, when it exists at all, treats the human at the desk as a body to be supported and a posture to be corrected. That model is built for the 8-hour meeting worker. It is not built for a vibe builder who is heads-down with Claude Code, Cursor, and a debugger from 10 AM to 10 PM.
Over a 12-hour session, the variables that quietly degrade cognitive performance are not posture and lighting. They are CO₂ creeping past 1,000 ppm in a closed room, off-gassing TVOCs accumulating from electronics and carpets, ambient noise drifting up as the building HVAC cycles, and room temperature drifting outside the narrow band where typing speed and decision-making stay sharp. By hour eight, the room feels wrong in a way the builder can't name — and the code reflects it before the body does.
Thinking Desk's engineering brief was direct: detect what the body misses, measure it continuously, and surface the readings in one Workspace Score that compresses six metrics into a single number a builder can glance at between commits. This paper documents how each sensor chip was selected, where it sits in the keypad, and how the resulting data flows to the app.
Literature review
CO₂ and decision-making
Satish et al. (2012), in a controlled chamber study at Lawrence Berkeley National Laboratory, exposed test subjects to CO₂ concentrations of 600, 1,000, and 2,500 ppm and measured decision-making performance using the Strategic Management Simulation battery. Performance on six of nine SMS scales dropped moderately at 1,000 ppm; performance on seven of nine scales dropped severely at 2,500 ppm. The conclusion: CO₂ at concentrations regularly reached in closed offices and home work spaces — particularly during long unventilated sessions — measurably degrades the cognitive functions that builders depend on.
Allen et al. (2016), in a six-day double-blind crossover study with 24 office workers at the Harvard T.H. Chan School of Public Health, showed cognitive function scores that were roughly twice as high in a low-CO₂, low-TVOC "green+" condition compared to a conventional-office condition. The effect was most pronounced for higher-order tasks: strategy, information usage, and crisis response. Both studies describe CO₂ effects in absolute parts per million, not in a derived index — a fact that determined our CO₂ sensor choice, described later.
TVOCs and cognitive load
Total volatile organic compounds accumulate indoors from carpets, electronics, cleaning products, and off-gassing furniture. Mendell and Heath (2005), in a literature review covering decades of indoor environment studies, identified TVOCs as one of the most consistently reported predictors of self-reported attention loss, headache, and irritation among office workers. Wargocki and Wyon (2017) extended this with a meta-analysis showing measurable productivity loss at TVOC concentrations well below regulatory thresholds for acute health effects.
Particulate matter and air quality
Particulate matter — specifically PM2.5, the size class small enough to enter the bloodstream through the lungs — has well-documented chronic effects on cognitive function over years of exposure (Power et al., 2011). Acute effects within a single session are smaller but measurable, particularly for sources close to the builder: laser printers, cooking adjacent to the workspace, dust disturbance from movement. PM measurements combine with NOx and VOC readings to produce a single Air Quality Index value that summarizes the air at a glance.
Noise and executive function
Hygge (2003) and subsequent work consistently show that ambient noise above approximately 65 dB(A) impairs working memory, recall, and complex problem-solving — even when subjects report they have "adapted" to it. The effect is more pronounced for intermittent noise (HVAC cycling, doors, traffic) than for steady background hum. For a builder running long coding sessions in environments not designed for deep work — apartments, coworking spaces, coffee shops — the slow drift of ambient noise is a quiet cognitive cost.
Temperature, humidity, and typing performance
Seppanen, Fisk, and Lei (2006), in a review of office-environment temperature studies, established a performance curve that peaks between 21–23 °C (70–74 °F). Beyond this band, typing speed, error rate, and complex-task accuracy decline measurably; at room temperatures above 26 °C (79 °F), performance loss reaches 5–10%. Humidity has a parallel effect through a different mechanism: Wolkoff (2018) documented that indoor relative humidity below 30% accelerates dry-eye symptoms, throat irritation, and self-reported cognitive fatigue across long sessions.
Design problem
The design problem is to deliver continuous, accurate measurement of the variables the literature identifies as cognitive-performance predictors, at a sensor cost and form factor compatible with a standing desk's keypad. The system must: (a) cover the major variables — CO₂, TVOCs, particulates, temperature, humidity, noise; (b) sit close enough to the builder's actual breathing zone to produce data that reflects what the builder is breathing, not what the room average looks like; (c) know whether a builder is at the desk at all, so that the data is interpreted in the right context; and (d) compress six metrics into one Workspace Score for at-a-glance use, without losing the per-metric detail for builders who want it.
Key design objectives:
- Six metrics covering the variables the literature identifies as cognitively significant — not a marketing-driven sensor count.
- True NDIR CO₂ measurement, not estimated CO₂, because the cognitive-performance research describes effects in absolute ppm and an estimate-based reading can land a builder on the wrong side of the 1,000 ppm threshold.
- Sensor placement in the keypad rather than the column or frame, so the sample point sits in the builder's breathing zone during seated work.
- Presence detection independent of the height-adjustment sensor, so that sit/stand and Workspace Score data is only logged when the builder is actually at the desk.
- A single composite Workspace Score derived from the six metrics, with the per-metric breakdown surfaced one tap deeper for builders who want the detail.
Methods
Sensor selection was driven by three criteria: published accuracy specifications relevant to the cognitive-performance research, long-term stability sufficient for a multi-year product lifespan without recalibration, and form factor compatible with the keypad housing. Candidate chips were benchmarked against laboratory-grade reference instruments (photoacoustic NDIR CO₂ analyzer, photoionization detector for TVOCs, optical particle counter for PM, calibrated sound-level meter, and certified thermo-hygrometer) under controlled chamber conditions covering the typical operating range for an indoor workspace.
Cross-sensor contamination — particularly the influence of heat from the keypad's own electronics on the temperature and humidity readings — was characterized through thermal imaging of the keypad enclosure during continuous operation. Sample rate, smoothing, and alarm-threshold defaults were tuned against the published cognitive-performance curves, not against arbitrary regulatory limits.
Design solution
Five sensor chips, six metrics, one presence signal
The keypad PCB carries five sensor chips. Four of them produce metrics that the builder sees in the app dashboard. The fifth is a Time-of-Flight distance sensor whose only job is to know whether someone is at the desk. The metric count exceeds the chip count because one chip — Sensirion's SEN55 environmental air quality node — does the work of four single-purpose sensors at once.
The Thinking Desk keypad PCB: Sensirion SEN55 (environmental air quality node), Sensirion SCD41 (NDIR CO₂), MiCS-5524 (MOS multi-gas), ICS-43434 (digital MEMS microphone), and VL53L0X (Time-of-Flight laser distance) — five chips, six metrics, one presence signal.
Sensirion SEN55: four metrics from one chip
The SEN55 is Sensirion's all-in-one environmental sensor node. Internally it integrates PM1.0, PM2.5, PM4.0, and PM10.0 measurement, a VOC index, an NOx index, relative humidity, and temperature. From this single chip, Thinking Desk reads four of its six dashboard metrics: temperature, humidity, AQI (computed from the PM and NOx channels), and TVOC (from the VOC index channel).
Using one high-end environmental sensor instead of four single-purpose chips reduces calibration complexity (one chip, one calibration target), power draw, and PCB real estate — significant for the keypad's compact form factor. It also eliminates sample-time skew between channels, because every measurement is taken from the same physical sample volume at the same moment, rather than from four separate intake points that may see different micro-conditions on the PCB.
Sensirion SCD41: NDIR CO₂, not estimated
The SCD41 is a true NDIR (non-dispersive infrared) CO₂ sensor — specifically, a photoacoustic NDIR sensor built on Sensirion's PASens technology. Unlike metal-oxide eCO₂ sensors that estimate CO₂ from a correlated VOC signature, the SCD41 measures CO₂ molecules directly via infrared absorption. Typical accuracy: ±(40 ppm + 5% of reading) over the 400–5,000 ppm range.
The SCD41 costs significantly more than a metal-oxide eCO₂ chip. We chose it because the Satish and Allen studies describe CO₂ effects in absolute parts per million — 1,000 ppm, 1,500 ppm, 2,500 ppm. An eCO₂ sensor that tracks the trend but drifts ±150–200 ppm from absolute is enough to put a builder on the wrong side of the 1,000 ppm threshold when the room actually needs ventilation. A true NDIR is the difference between knowing the room is at 950 ppm or 1,150 ppm — and that difference matters for whether the desk tells the builder to open a window.
MiCS-5524: gas-leak safety layer
The MiCS-5524 is a metal-oxide multi-gas sensor sensitive to carbon monoxide, ethanol, hydrogen, ammonia, methane, and propane. It does not drive a primary metric in the dashboard. Its role is event detection: sudden elevated CO from an HVAC malfunction, propane leak from a nearby kitchen, ethanol vapor from cleaning products in process. These are not 12-hour-session degraders; they are acute safety signals. The chip is included so the keypad can flag them when they appear — outside the normal Workspace Score view, as an alert rather than a dashboard reading.
ICS-43434: digital MEMS microphone
The ICS-43434 is an I²S digital MEMS microphone with on-chip A-weighting and a typical signal-to-noise ratio of 65 dB. It samples continuously and outputs sound pressure level over a one-second averaging window. The Workspace Score uses both an absolute threshold near 60 dB(A) and a rate-of-change threshold for sudden noise events — because the Hygge literature distinguishes steady noise from intermittent noise as cognitive disruptors with different magnitudes.
VL53L0X: presence and posture awareness
The VL53L0X is a Time-of-Flight laser distance sensor from STMicroelectronics, capable of measuring distance up to 2 meters with millimeter resolution. In Thinking Desk's keypad it serves a different purpose from the air sensors: it detects whether a builder is at the desk. The sensor points outward from the keypad face; when it reads a distance consistent with a person at typical seated or standing distance, the firmware marks the builder as present. When the reading goes long — no one in range — the desk knows the builder has stepped away.
Combined with the desk's existing height-sensor data, this presence detection lets the app classify the builder's state as Sitting, Standing, or Away — visible at the top of the Today view as a status badge, and the basis for sit/stand time tracking that doesn't false-count time spent at lunch as standing time.
Why the keypad placement matters
Sensor placement determines what the data actually means. A CO₂ sensor in the desk leg, near the floor, reads the room's lowest CO₂ zone. A CO₂ sensor on a ceiling-mounted thermostat reads the room average, which can lag the builder's actual breathing zone by minutes. A CO₂ sensor in the keypad, sitting roughly where the builder's hands rest, sits in the breathing zone — close enough to register the builder's own exhalation plume on tight days, and close enough to see room conditions change quickly when the builder opens a window or turns on ventilation.
The same logic applies to temperature (skin-near vs ceiling-far makes a 1–2 °C difference), noise (head-level vs floor-level reads different sources), and TVOCs (builder-near vs room-average captures point sources like a hot laptop differently). Putting the sensors in the keypad rather than the frame is not a packaging convenience. It is a measurement decision.
From six metrics to one Workspace Score
The Workspace Score (0–100) compresses the six dashboard metrics into a single number. Internally, the score is computed as a weighted aggregate of two sub-scores: Air Quality (from CO₂, TVOC, AQI) and Environment (from temperature, humidity, noise). Each sub-score uses cognitive-performance breakpoints from the literature, not regulatory thresholds. The aggregate weights the two sub-scores together with a slight bias toward the Air Quality side, because the literature evidence is stronger and more acute for CO₂ and TVOCs than for ambient temperature within the typical indoor range.
Builders who want the per-metric detail tap through to the Environment and Air Quality cards, which show each reading in its native unit with a category label and a short interpretation. Builders who want a glance see only the score.
Results: What we measured
Sensor accuracy vs reference instruments
All six dashboard metrics were benchmarked against laboratory references in a controlled chamber across the indoor operating range. Temperature and humidity tracked the reference thermo-hygrometer within ±0.3 °C and ±3% RH. The ICS-43434 microphone tracked the calibrated sound-level meter within ±2 dB(A) across the 30–90 dB range. The SEN55's PM channel tracked the optical particle counter within ±10% above 10 µg/m³ — accurate enough to identify AQI category changes, which is the resolution relevant to the dashboard.
The SCD41 NDIR CO₂ sensor tracked the reference photoacoustic NDIR analyzer within ±50 ppm across the 400–2,500 ppm range — well inside the chip's rated ±(40 ppm + 5%) accuracy specification. The SEN55's VOC index tracked the PID reference within ±15% across the typical TVOC operating range, which is the practical accuracy limit of any consumer-grade VOC measurement.
Cross-sensor contamination
Thermal imaging during continuous operation showed that the keypad enclosure rises approximately 2–3 °C above ambient under sustained electronics load. The SEN55 chip is mounted on a thermally isolated section of the PCB, with a sampling vent oriented away from the heat-producing components. Calibration of the resulting offset is performed in firmware. The net result: the displayed temperature tracks ambient within ±0.5 °C across operating loads.
Presence detection accuracy
The VL53L0X presence reading was validated against ground-truth video recordings of test sessions covering typical desk use: seated work, standing work, brief steps away (under 30 seconds), longer breaks, and complete departures. Presence state changes were detected within 2 seconds of the builder leaving or returning to the desk at the 95th percentile. False positives — the desk marking a builder present when no one was there — occurred when reflective objects (laptop screens, framed monitors) were placed within the sensor's range during prototype testing; the firmware now includes a debounce window and a minimum-distance threshold tuned to typical human geometry to suppress these.
App latency
End-to-end latency from sensor reading to app display, measured across 100 trials under typical home-network conditions, averaged 1.4 seconds at the 50th percentile and 1.9 seconds at the 95th percentile. The path is sensor → keypad MCU → local bluetooth or Wi-Fi link → app. The Workspace Score recomputes on every new sensor reading; the per-metric cards update independently as new values arrive.
Beyond the sensors: what else the app shows
Two additional capabilities surface in the Thinking Desk app alongside the sensor dashboard. Neither is part of the sensor engineering documented above; both reuse existing data sources rather than adding new hardware. They are covered here briefly for completeness, and so that builders evaluating Thinking Desk can see them documented in the same place as the sensor work.
Sit/stand time tracking
The keypad already knows the desk's current height — that data drives the memory presets and the up/down feedback. The VL53L0X already knows whether a builder is at the desk. Thinking Desk's firmware combines the two: when the height transitions from below 36 inches to above 38 inches and the presence sensor confirms a builder is at the desk, the state flips from Sitting to Standing. When the presence sensor goes long, the state flips to Away — and the time clock for sitting and standing pauses. Daily totals roll up at midnight; weekly and monthly aggregates surface in the app's History tab.
Posture cadence — not posture per se — is what the literature identifies as the variable that matters (Karakolis & Callaghan, 2014). A builder who shifts between sitting and standing every 90 minutes is supported by every standing-desk study ever published; a builder who stands all day or sits all day is not. Tracking the cadence gives the builder the data to see their own pattern and adjust it. Combining height-sensor data with VL53L0X presence detection means the cadence is honest: time spent away from the desk doesn't get counted as standing time just because the desk was raised when the builder left.
Claude Code token tracking
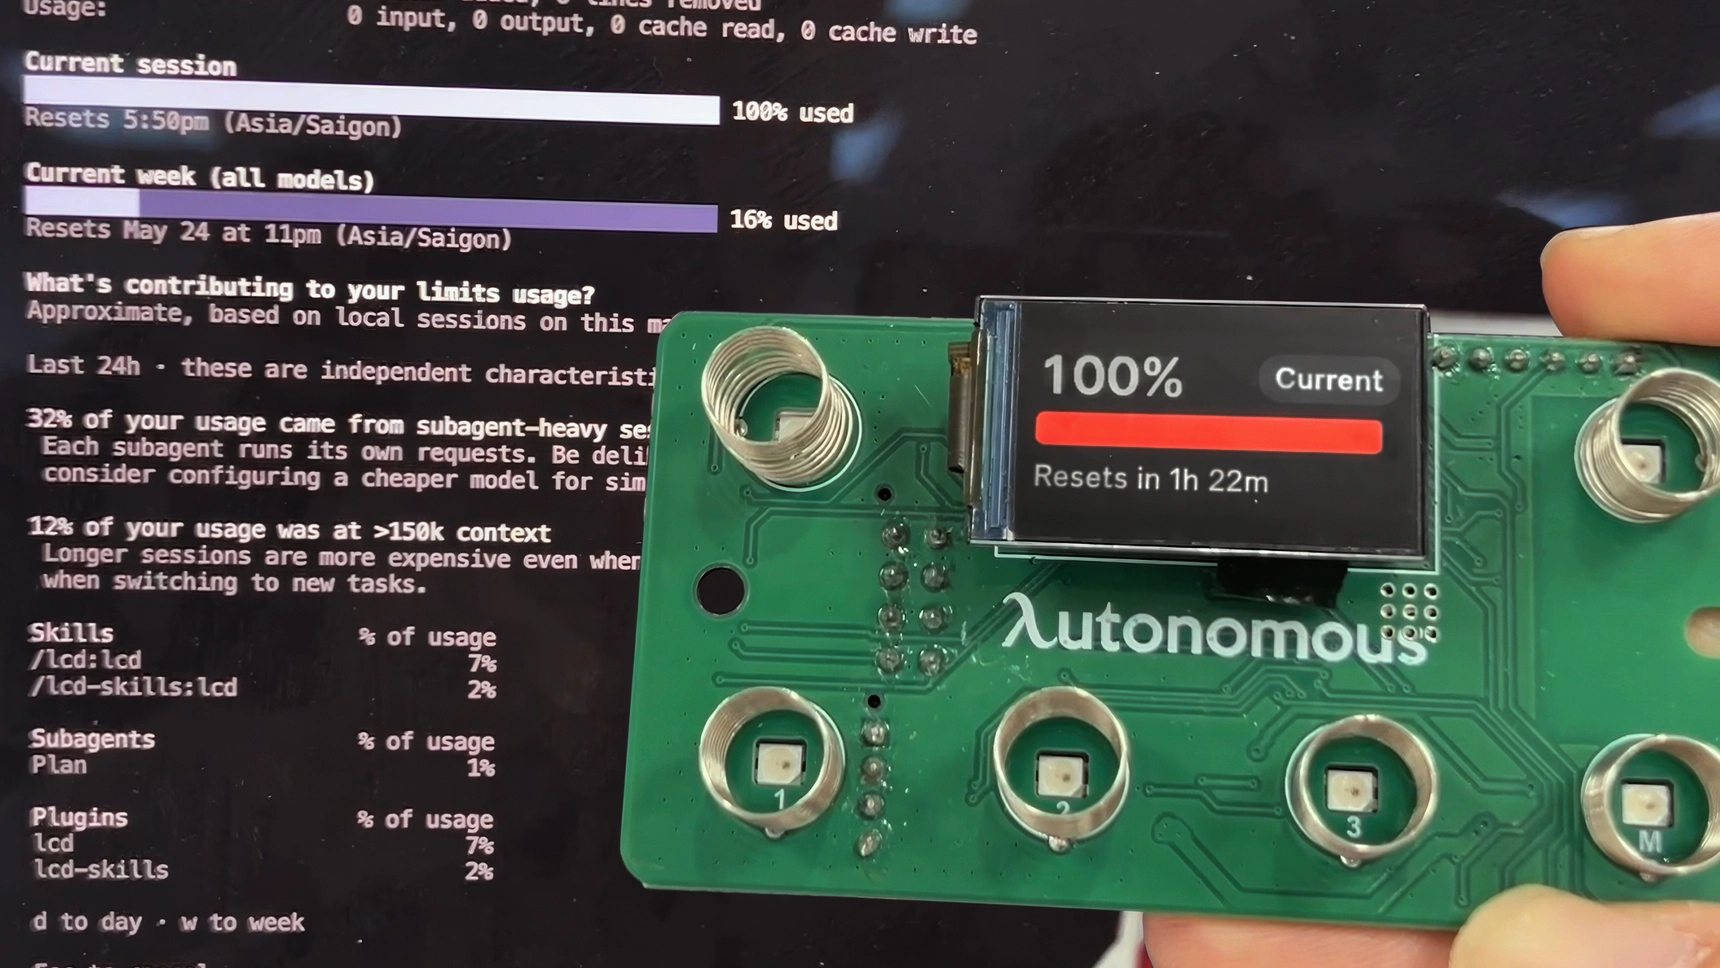
Thinking Desk's app reads Claude Code usage through the standard API and surfaces the live token rate, the session total, and the cumulative daily burn. The integration is data-only — no notifications, no nags, no automation that interferes with the coding session itself. The app just shows the number.
Why this matters for builders, specifically: a builder's primary work output is not steps walked or hours sat. It is code shipped — and increasingly, for builders working with agents, it is tokens spent. Token activity is an honest proxy for cognitive engagement: tokens flow when the builder is actively prompting, reviewing, iterating; tokens slow when the builder steps away or stops thinking. Seeing token rate against the day's clock gives builders the same kind of self-observation that the air-quality dashboard gives — a way to notice their own pattern without having to actively measure it. A builder who consistently sees token rate fall off after 8 hours has data that says something about how long they can productively code in a day. A builder whose token rate is steady through hour ten has different data.
The token view is independent of the sensor view. They share a screen but not a model. Builders who care about the air data don't need to use Claude Code; builders who care about token data don't need to look at the sensors. The integration is parallel, not coupled.
The Thinking Desk app's Today view: a Sitting/Standing/Away status badge at the top (powered by the VL53L0X presence sensor combined with the height sensor), and the six dashboard metrics broken out as individual cards with category labels and short interpretations. The Workspace Score, sit/stand time, and Claude Code activity live in their own tabs.
Discussion
Tradeoffs we made, honestly
Five sensor chips at this price point require choices. The ones we made deliberately:
- One environmental node, not four single-purpose chips. Using the Sensirion SEN55 means a single failure point for four of our six metrics — if that chip drifts or fails, four readings drift or fail together. We chose the integrated chip because the calibration and power benefits outweighed the redundancy loss, and because Sensirion's published long-term stability data on the SEN55 is competitive with single-purpose alternatives. Builders who want independent cross-validation can pair Thinking Desk with a second air-quality monitor.
- NDIR CO₂, not eCO₂. A true NDIR CO₂ sensor costs significantly more than a metal-oxide eCO₂ chip. We made this choice deliberately, because the cognitive-performance literature describes CO₂ effects in absolute ppm and an estimate-based reading can land a builder on the wrong side of the 1,000 ppm threshold. The cost shows up in the BOM. We think the absolute accuracy is worth it for the use case.
- AQI is a composite from the SEN55 channels. The AQI value is computed from the SEN55's PM, NOx, and VOC channels — it is not a US EPA AQI calculation in the strict sense. Builders in environments with high outdoor air pollution who want to compare against EPA AirNow readings should not expect the numbers to match exactly; the Thinking Desk AQI tracks the same trends but uses an indoor-focused scaling.
- Keypad placement, not multi-point. A single keypad sensor represents the builder's local zone better than a column-mounted or floor-mounted sensor — but it cannot capture room-wide variation. Large rooms with stratified air or asymmetric ventilation will show the keypad reading, not the room average.
- Presence detection has a known false-positive mode. The VL53L0X reads distance, not human presence directly. Reflective objects placed within sensor range during early testing produced false positives. The current firmware filters by distance and motion patterns to suppress these, but builders who place reflective hardware directly in the keypad's line of sight may see occasional false-present readings. Move the obstruction or adjust the keypad orientation if this happens.
These are honest gaps. We list them because the alternative is pretending the sensors are laboratory-grade for every purpose, which is the kind of claim that consumer-priced sensors do not earn.
What five sensors add up to
The case for Thinking Desk's sensor layer is not that any single chip is unique. CO₂ monitors, air-quality dashboards, and standing-desk presence sensors all exist as standalone products. The engineering case is that the six readings — sampled from the builder's breathing zone, computed into one score, paired with honest sit/stand-with-presence tracking, and surfaced in a live app — give a builder something a desk has not given before: a measurement of the room that is also a measurement of the conditions under which they think. By hour eight of a 12-hour session, when the room feels wrong, the Workspace Score has already named what changed.
What we'd still like to test
Long-term drift of the SEN55 across the multi-year horizon, particularly in workspaces with high VOC backgrounds (kitchens, garages, recently renovated rooms). Calibration of the AQI composite against independent air-quality monitors across a broader range of indoor environments than internal testing covers. Effects of the dashboard itself on builder behavior — do builders who see their CO₂ in real time actually open windows more often, and does it show up in their token activity? VL53L0X presence detection in unusual desk layouts — multi-monitor arms in the line of sight, reflective whiteboards across the room. If you've used Thinking Desk for over six months and want to share field data, ping us. We're collecting it.
References.
Allen, J. G., MacNaughton, P., Satish, U., Santanam, S., Vallarino, J., & Spengler, J. D. (2016). Associations of cognitive function scores with carbon dioxide, ventilation, and volatile organic compound exposures in office workers: A controlled exposure study of green and conventional office environments. Environmental Health Perspectives, 124(6), 805–812.
Hygge, S. (2003). Classroom experiments on the effects of different noise sources and sound levels on long-term recall and recognition in children. Applied Cognitive Psychology, 17(8), 895–914.
Karakolis, T., & Callaghan, J. P. (2014). The impact of sit-stand office workstations on worker discomfort and productivity: A review. Applied Ergonomics, 45(3), 799–806.
Mendell, M. J., & Heath, G. A. (2005). Do indoor pollutants and thermal conditions in schools influence student performance? A critical review of the literature. Indoor Air, 15(1), 27–52.
Power, M. C., Weisskopf, M. G., Alexeeff, S. E., Coull, B. A., Spiro, A., & Schwartz, J. (2011). Traffic-related air pollution and cognitive function in a cohort of older men. Environmental Health Perspectives, 119(5), 682–687.
Satish, U., Mendell, M. J., Shekhar, K., Hotchi, T., Sullivan, D., Streufert, S., & Fisk, W. J. (2012). Is CO₂ an indoor pollutant? Direct effects of low-to-moderate CO₂ concentrations on human decision-making performance. Environmental Health Perspectives, 120(12), 1671–1677.
Seppanen, O., Fisk, W. J., & Lei, Q. H. (2006). Effect of temperature on task performance in office environment. Lawrence Berkeley National Laboratory Report LBNL-60946.
Wargocki, P., & Wyon, D. P. (2017). Ten questions concerning thermal and indoor air quality effects on the performance of office work and schoolwork. Building and Environment, 112, 359–366.
Wolkoff, P. (2018). Indoor air humidity, air quality, and health — An overview. International Journal of Hygiene and Environmental Health, 221(3), 376–390.